Colorimetry / Color matching technologies
Desired colors are produced from accurate calculation of the blending ratio. We create a world of color with our own system.
Combined use of isomeric matching (method of fitting reflectivity to a target color) and metameric matching (method of fitting tristimulus values to a target color) produces an optimal solution with few metamerism problems.
If multiple recipes are possible for creating a target color, problems and complaints generated by later processes can be prevented in advance by selecting the best choice for color material blending with less color fluctuation and the use of durable color materials, etc.
Such functions are also a critical factor in selecting KURABO CCM.
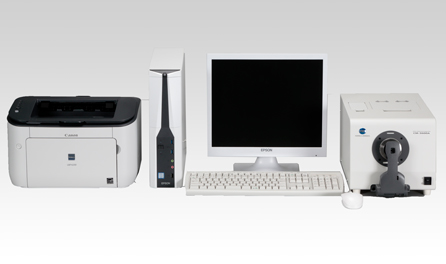
CCM (Computer Color Matching) System
CCM is a system that measures the reflectivity of a target color with a colorimeter (spectrophotometer) and calculates the blending ratio of color materials (primary color) to reproduce the color.
■ Principle of colorimetry (scheme)
■ General CCM flow
Merits of CCM
ICI (Imperial Chemical Industries), the company that first released CCM on a commercial basis, called this system IMP (Instrumental Match Prediction). This basically means “prediction of color recipes with the use of an instrument”, so the term expressed the essence of CCM.
To predict color recipes, data, means and methods are necessary for grounds for the prediction. The performance of CCM depends on data accumulation sites and the means and methods for prediction.
KURABO’s CCM enables color designing without metamerism, color material blending with less color fluctuation, and selection of highly durable color materials, not just the provision of color recipes. Problems in the process and complaints can be prevented in advance by selecting optimal recipes.
■ Principle of colorimetry (scheme)
Tips 1About Color
Tips1-1.
Recognition of color and view angle
Almost everything around us has its own color or colors. Why do leaves look green?
The following three elements are involved when we see and recognize the color of an object:
・Light
・Object having color
・Human sensation
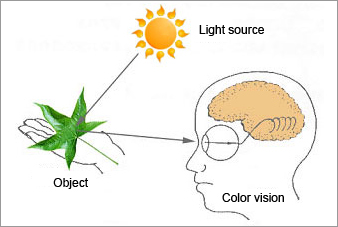
Fig. 1: Perception of colors
Light is one type of electromagnetic wave, which include gamma rays, X-rays, ultraviolet rays, visible infrared rays, and radio waves in the ascending order of their wavelengths. X-rays (which are used for radiography) and radio waves (which are used for TV, radios, and cell- phones) are examples of magnetic waves that we are familiar with. As described in "Information on Infrared Rays," infrared rays are used for a variety of analyses.
Visible rays, as the name implies, are rays that have wavelengths ranging from 380 to 780 nm (nm: one billionth of 1 meter).
As shown in Fig. 2, visible rays have colors specific to each wavelength (colors of light). Light that has continuous energy across the entire range of visible wavelengths, such as sunlight, is called white light.
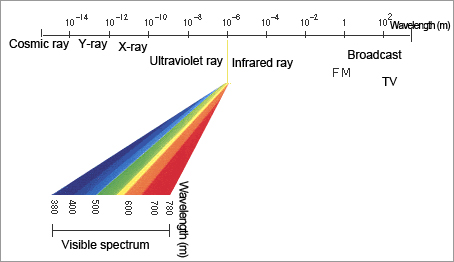
Fig. 2: Electromagnetic waves vs. visible rays
When the leaf is perceived as green in sunlight, the following process occurs, as shown in Fig. 1:
1. The white light emitted by the sun reaches the leaf.
2. Part of the white light is absorbed by pigments of the leaf and the other part reflected.
3. The reflected light reaches our eyes and is perceived as a color by our brains.
In other words, when the leaf has green pigments, the red color, which is the complementary color of green, is absorbed. The color that has been reflected and reaches our eyes is the color of the white light without the red component; i.e., green. In this way, the color of light that reaches our eyes is determined.
Expressing this mechanism scientifically, the energy specific to each wavelength of light from the light source is called the spectral distribution of the light source, and it is represented by the symbol S(λ). The light-reflecting property of an object is called the spectroscopic reflectance factor (or simply the reflectance) and is represented by the symbol R(λ).
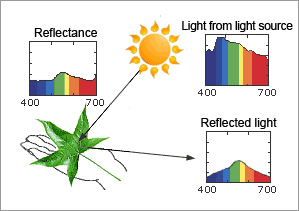
Fig. 3: Process of generation of reflected light
When S(λ) is multiplied by R(λ) for each wavelength, the product represents the reflected light, which is shown using the symbol of S(λ)・R(λ).
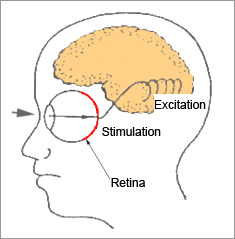
Fig. 4: Color received by the eye
The excitations resulting from red, green, and blue stimulation are referred to as three stimulation values, and are represented by the symbols X(λ), Y(λ), and Z(λ). To obtain X, Y, and Z, color-matching functions are required. Color-matching functions are the values that have been experimentally determined to show to what extent the red, green, and blue stimulations are felt for each wavelength of light. The relationship between them is shown in Fig. 5.
The x(λ) function represents the degree to which redness is sensed at each wavelength. The y(λ) and z(λ) functions similarly represent the respective degrees for blueness and greenness at each wavelength. This means that the degree of red, blue, and green stimulation is considered to be the accumulated effect of stimulations between the wavelengths that can be sensed. Once the values for the reflected light that enters the eye and the color-matching functions are found, the X, Y, and Z values for the resulting stimulation intensity can be obtained.
All of the currently used colorimetric values and color difference values are based on these three stimulation values. Various attempts have been made to match the distribution of colors and the degrees of color differences sensed by the human eye.
This will be explained in further detail in "1.3 Method of expressing colors."
Shown below is the equation for finding the three stimulation values for object colors:
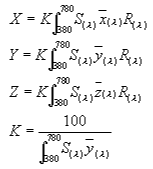
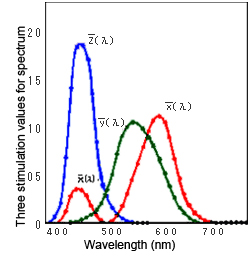
Fig. 5: Color-matching functions
When a color is measured, the following difference occurs in the human eye depending on the size of the object:
Fig. 6: View angle
The extent of the image formed on the retina differs depending on the size of the object. The retinal cells in the outer area are known to be less sensitive than those in the central area. Therefore, when a color in a large area is viewed, the sensitivity of retinal cells in the outer area causes a different stimulation than that caused when a color in a small area is viewed. The size of the object is represented by the angle at which the light enters the eye, which is also known as the view angle.
The color-matching functions described in "1-1. Recognition of colors" are available for two different view angles, 2 degrees and 10 degrees. They are distinguished and expressed as X, Y, and Z and X10, Y10, and Z10. When the view angle is less than 4 degrees, the color-matching function for the view angle of 2 degrees is used. When the view angle is more than 4 degrees, the color-matching function for the view angle of 10 degrees is used.
The view angle of 2 degrees is equivalent to the state in which an object with a diameter of 1.7 cm is viewed from a distance of 50 cm; the view angle of 10 degrees is equivalent to the state in which an object with a diameter of 8.8 cm is viewed from 50 cm.
Tips1-2.
Expressing colors
The three stimulation values do not represent the distribution of colors and color differences that are felt by the human brain. Many academics have been making attempts to match them with human sensations, and some of these attempts are described below:
CIE XYZ colorimetric system
This colorimetric system has been developed based on light's three primary colors proposed by T. Young and H. Helmholtz. The chromaticity chart is used to show colors with Yxy. Y represents brightness and xy hue.
As shown in Fig. 7, chromatic colors are located at the center and chroma saturation becomes higher toward the circumference. The ellipse is MacAdam's deviation ellipse, which is formed by magnifying by 10 times the area that the normal observer can not distinguish from the central chroma. It can be seen that the distinguishing distance varies depending on the position.
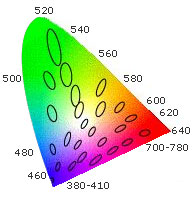
Fig. 7: Chromaticity chart colors and MacAdam's deviation ellipse
CIE1976 L*a*b colorimetric system
This colorimetric system was standardized and recommended byCIEin 1976. It provides color spaces that are perceptually almost equidistant in all directions, and it is widely used today in various fields.
In this colorimetric system, L* represents brightness and a* and b* hue and chroma saturation, respectively, as chromaticity.
a* shows red in the positive direction and green in the negative direction. b* shows yellow in the positive direction and blue in the negative direction. When both a* and b* are zero, they represent an achromatic color, such as gray, which includes white and black.
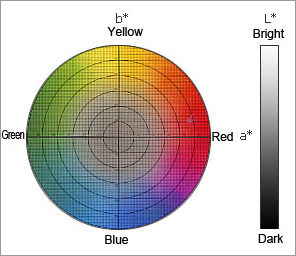
Fig. 8: CIE1976 L*a*b* colorimetric system
CIE1976: L*C*H* colorimetric system
In the L*a*b* colorimetric system, which was standardized and recommended by CIE in 1976, chromaticity is expressed using h* (hue) and C* (chroma saturation). This is not used as an independent colorimetric system, but is sometimes considered as one of the elements of the L*a*b* colorimetric system.
H* ,a* is expressed by a counterclockwise angle assuming the positive axis is at 0 degrees. C* is expressed by the distance from the origin.
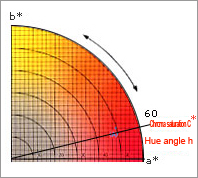
Fig. 9: CIE1976 L*C*H* colorimetric system
Munsell colorimetric system
This colorimetric system was devised by A.H. Munsell, a painter. It was subsequently modified, reviewed, and then proposed by the Optical Society of America in 1943. This modified Munsell colorimetric system is widely used today. It was adopted in JIS8721 and its contrast with the XYZ colorimetric system is specified.
In the Munsell colorimetric system, the perceived color is expressed as HV/C using three attributes: hue (H), brightness (V), and chroma saturation (C).
Fig. 10 shows the relationship between hues on the left, which is called the Munsell hue circle. The center of the hue circle consists of achromatic colors. The chart shown on the right shows a cross section of the hues, which is called the Munsell color chart. The Munsell color chart shows chroma saturation horizontally and brightness vertically.
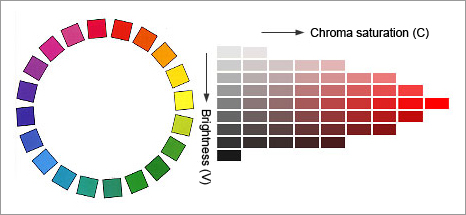
Fig. 10: Munsell colorimetric system
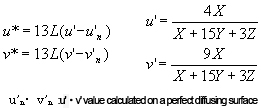
CIE1976 L*u*v* colorimetric system
This colorimetric system is used in relation to illumination rather than the color of an object. The L value is calculated using the same method as in the 76L*a*b* colorimetric system. u*v* is chromaticity represented by hue and chroma saturation, and it can be found using the equation below:
Tips1-3.
Kinds of color mixtures
Even if no object exists, a color can be seen as long as there is light. As mentioned earlier, light has a color specific to each wavelength. The seven colors seen as a rainbow are spectroscopic light itself. The colors seen on TV are also those of light. When colors of light are mixed with each other, a stimulation results from the addition of their three respective stimulation values.
When the stimulation is intensified by mixing colors as described above, this is called an additive color mixture. In contrast, when colored filters are overlaid, the transmission of light decreases. This kind of color mixing is called a subtractive color mixture.
| Color of light | Color of object | ||
|---|---|---|---|
| Overlaying of colored rays | Overlaying of colored filters | Mixture of ink, dyestuff, or pigments | |
| Primary color | Red, green, and blue R・G・B 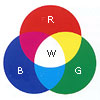 |
Yellow, magenta, and cyan Y・M・C 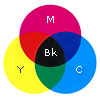 |
Yellow, rouge, and indigo Y・R・B 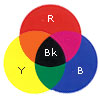 |
| Color mixture | Additive color mixture | Subtractive color mixture | Subtractive color mixture |
| Representation of brightness | Bright - Dark Bright - Dark |
White - Black White - Black |
|
Fig. 11: Color mixing theory
The result of mixed color can be more easily estimated in an additive color mixture, but estimation of the result in a subtractive color mixture is complicated.
Besides, in the mixing of inks, dyes, and pigments, the influence of colored material makes the process more complicated.
In this document, the color mixture of inks, dyes, and pigments are focused on so the color mixture for the light is omitted.
Tips1-4.
Measuring an object’s color
The color measurements are roughly classified into the following two methods:
・Spectrophotometric colorimetry
・Colorimetry by directly reading stimulation values
The apparatus that enables spectrophotometric colorimetry is a spectrophotometer, which basically consists of the combination of a light source, a spectroscope, and an optical receiver.
| Condition a | Condition b | Condition c | Condition d |
|---|---|---|---|
 Vertical reception of 45-degree illumination |
 Reception of vertical illumination |
 Vertical reception of diffusive illumination |
 Diffusive reception of vertical illumination |
| L represents a light source, R an optical receiver, B a shield, and S a specular trap. | |||
Fig. 12: Four reception conditions for color measurements
Colorimetry that directly reads the three stimulation values uses a photoelectric colorimeter.
The colorimeter uses three colored filters (instead of a spectroscope) among the basic elements of the spectrophotometer, in addition to a sensor that has sensitivity for three stimulation values for spectrums. For this apparatus, there is a standard (called the router condition) that is used to coordinate the value for a color-matching function with the sensor's sensitivity.
In general, it is difficult to arbitrarily change the spectral distribution of an optical receiver or filters. Therefore, it is difficult to perfectly meet the router conditions.
Tips1-5.
Metamerism and color rendering properties
Color rendering refers to the phenomenon in which colors are seen differently depending on the light source used for illumination, and its properties are called color rendering properties.
In general, color rendering properties represent the properties of a light source as compared with natural light.
Metamerism is also known as the isochromatic condition, which means that, under certain conditions, matching colors appear different as conditions change. Metamerism can involve humidity, temperature, light sources, etc., but it typically refers to metamerism between light sources.
As shown in Fig. 13, even if the colors change with a different light source, they may still look the same without metamerism. In contrast, there are cases where metamerism may be observed although no color rendering properties are involved. In essence, metamerism refers to a color comparison between samples.
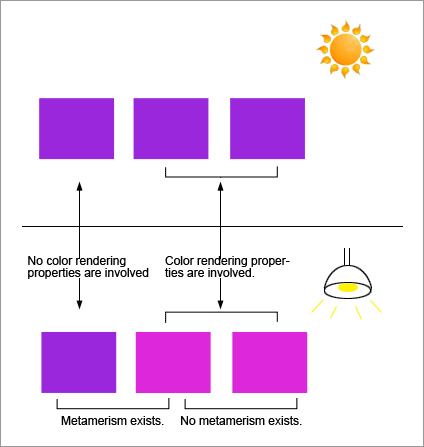
Fig. 13: Color rendering properties and metamerism
Tips 2Reading Color Differences
Tips2-1.
CIE1976 L*a*b* color-difference formula
In "1. Basic knowledge of Chromatology", We have been describing the way of recognition and representation of color, toning the actual work of subtle color differences can be a problem. In the science of color that has been called for this difference is the difference between the color, various scholars have made various attempts as well as the color system.
This formula is widely used as the most standard color-difference formula, with which color differences are represented in the CIE1976 L*a*b* colorimetric system. The distances between the values for L*, a*, and b* found in the CIE1976 L*a*b* colorimetric system are used as color differences.
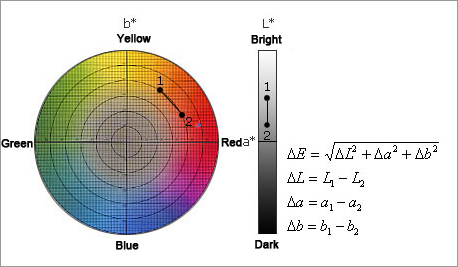
Fig. 14: CIE1976 L*a*b* colorimetric system
A hue difference ΔH and a chroma saturation difference ΔC may be substituted to express the color differences.
As shown in Fig. 14, ΔC means the difference between distances from the origin of the colorimetric system. ΔH comes from ΔH°(delta hue angle) that uses an angle difference of H and ΔH (delta hue difference) that is equivalent to the value obtained by subtracting the chroma saturation component from the chromaticity difference.
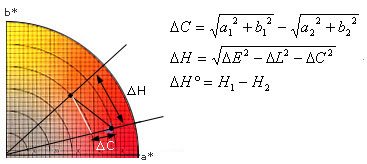
Fig. 15: L*C*H* color-difference formula
Tips2-2.
CMC(I:c) color-difference formula
The SDC Colorimetry Committee individually corrected brightness, chroma saturation, and hues in the CIE1976 L*a*b* colorimetric system and tried to differentially indicate even achromatic and bright colors at equal intervals by using the above formula. I and c as used in CMC (I:c) are classified by uses.
When I=c=1, the formula is used for the perception of color differences.
When l=2 and c=1, the formula is used for allowable color differences.
The CMC color-difference formula is calculated from CIE1976 L*a*b* as follows:
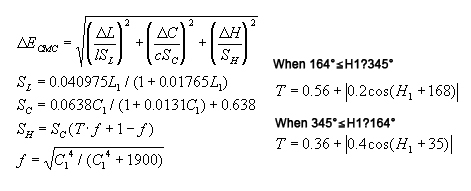
here L1 and C1H1 are the L* and C* values for the reference colors.
Tips2-3.
CIE94 color-difference formula
CIE established the TC1-29 technical committee in 1989, announced a technical report titled "CIE1994 Color-Difference Model" in 1995, and recommended the use of this model. I and c in CIE94 are classified by uses.、
When KL=KC=KH=1, the model is applied for general industrial uses.
When KL=2 and KC=KH=1, the model is applied for allowable color differences in the textile industry.
The CIE94 color-difference formula is calculated from CIE1976 L*a*b* as follows:
Cx is the reference color C; if either of them cannot be used as the  reference, calculate:
Tips2-4.
Present situation of the above formulas and other color-difference formulas
The color-difference formulas above are mainly used for toning operations.
The CIE1976Lab color-difference formula is used widely and has such commonality as compensates for its drawbacks. The reports on the CMC color-difference formula are often focused on textile products because it is well established in this industry and not in other industries. The CIE94 color-difference formula is not widely used in general industrial fields. Therefore, its close dependency on L, C, and H is simplified in comparison with the CMC color-difference formula. It has already been reported that the CMC color-difference formula produces better results for textile products. Thus, further studies in this respect are expected.
In other words, the above three color-difference formulas have both advantages and disadvantages, and they will continue to compete with each other in regard to versatility.
Today the following color-difference formulas are not often used for toning operations:
・The Adams-Nickerson color-difference formula
・Hunter's color-difference formula
・CIE1976 Luv color-difference formula
The color-difference formula that uses unique color control:
・The Marks & Spencer color-difference formula
Further description of these color-difference formulas is omitted here.
As described earlier, the quantification of color differences suitable for humans is still in the trial stage. However, this does not mean that color control cannot be performed using color differences. Any color-difference formula can be used as a tool for shipping management and quality control so far as the reference colors are established on a scale and are controlled.
Tips 3Planning and Design of Colors in Toning Operations
Tips3-1.
3-1.Design of color formulation
Under such circumstances, toning operations support the planning and design of colors, a step that will greatly influence the subsequent processes.
When a dyeing plant is taken as an example, fastness (durability) and color reproduction are keywords for the quality control of colors. In many cases, they are demonstrated in the inspection and testing process after production has been finished. These elements are mostly assessed based on the empirical rules of each plant and reflected as restrictions on the concentrations of dyestuffs used, the use of dyestuff combinations endorsed by successful results, and other techniques.
In computer color matching (CCM), formulations are designed by combining similar colors in order to improve color reproduction. For this purpose, the ability to reduce the range of color deviations and to predict fastness are required.
In planning and designing colors, the shape of a color sample adversely affects CCM. Such a sample may be laced, raised, or shaded, making it difficult to actually measure the color.
In case of calibrating a small sample which can not cover minimum area of spectrophotometer perfectly, making use of 2 kinds of backgrond color, Kurabo can estimate reflectance.
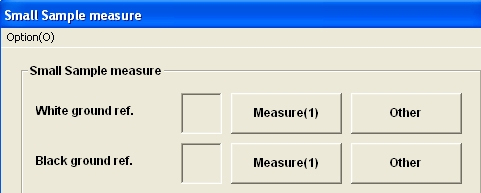
Fig. 16: Small Sample measure
Tips3-2.
Requirements for CCM
As is well known today, CCM stands for computer color matching. However, ICI Inc., which released the first commercial CCM system, used to call it IMP (instrumental match prediction). This name appropriately represents the nature of CCM.
To predict a color formulation, the data, means, and method that support the prediction are required. They determine the performance of the CCM system.
In determining whether a CCM system should be used, the important factors include where to store the data used to make predictions and whether the means and method for the predictions are appropriate.
An advanced CCM system not only predicts a color-matched formulation as a formulation design tool, but also suggests non-metameric color design, combinations of color materials with minimized color deviations, and choices of highly durable color materials. If multiple formulations are available for enabling the targeted color, the ability to choose the most suitable one will prevent any problem or complaint in the subsequent processes. This kind of capability is another important point in selecting a CCM system.
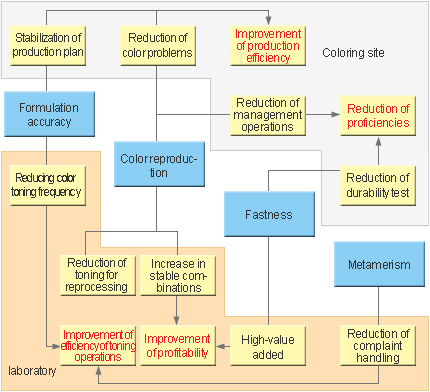
Fig. 17: Toning rationalization flowchart
Tips 4Formulating Colors
Tips4-1.
Viewing colors based on concentrations
we described chromatology which represents colors as values. In practice, how should a formulation be predicted? When coloring materials are mixed, the color changes due to the complicated mechanism called subtractive color mixture as described in"1-4. Kinds of mixtures."
This complicated mechanism was explained by P. Kubelka and F. Munk based on the absorption and diffusion caused by coloring materials.
Fig. 19 shows a model that has a coloring material layer with sufficient thickness X on the backing. If slight thickness dx exists in that layer, the light that has entered the coloring material layer is assumed to become light i that reaches dx and light j that reaches and is reflected on the backing. The sum of scattered light of i and transmitted light of j after scattering and absorption becomes the upward light.
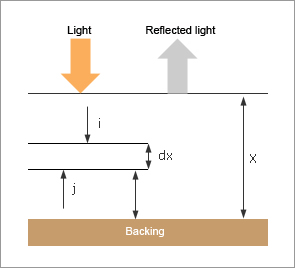
Fig. 18: The Kubelka-Munk model
When this model is simplified, it is expressed as the following equation, from which a value representing the attenuation ratio of light due to absorption and scattering is found based on reflectance.
Unlike reflectance, this K/S value numerically represents the nature of the coloring material layer. An easy way to understand it is to think of it as a value that is used to view a color as a concentration.
The color concentration decreases as the value for reflectance increases, and vice versa. However, the color concentration increases as the K/S value increases, and vice versa.
Tips4-2.
Mixing multiple colors
When a color is represented using absorption and scattering, a mixture of multiple coloring materials can be interpreted as having multiple layers. Thus, the color resulting from a subtractive color mixture can be predicted although this prediction was not possible using reflectance and three stimulation values. D. R. Duncan found that absorbance index K and scattering coefficient S have additive properties, and he proposed the following equation:
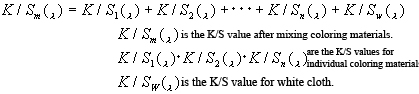
This equation is an approximation formula that is used when the S values for the backing and the white coloring material are large enough. For the primary equation, K and S are individually integrated.
Tips4-3.
Predicting the colors of individual coloring materials
Once the K/S values for individual coloring materials are found, the mixed color can be predicted. This means that when the K/S values can be predicted using the concentrations of coloring materials, the color resulting from the formulation can be found.
To obtain the K/S values for the concentrations of individual coloring materials, the function for the K/S values and the concentrations of the coloring materials must be obtained at each wavelength for reflectance.
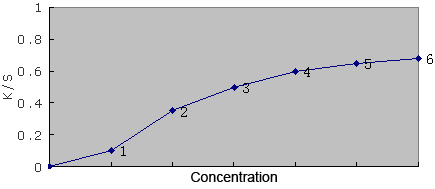
Fig. 19: Relationship between concentration and K/S
Samples individually colored with coloring materials, which are generally called basic data, are prepared at multiple concentrations, and then the intermediate value is estimated from the actual measured values. This means that once a concentration is determined, the K/S value at each wavelength for that concentration can be obtained.
Tips4-4.
Matching colors
4-4-1. Isomeric matching
A method for matching reflectance with the target color is available. CCM that utilizes this method is called isomeric matching. When reflectance is matched, the color change due tometamerismcan be eliminated completely. Thus, this is ideal color matching.
However, it is difficult to match reflectance unless the same coloring material and backing (fabric or paper) as the target color are used. Therefore, the use of this method is limited to those coloring industry companies that only use the coloring materials they have on hand.
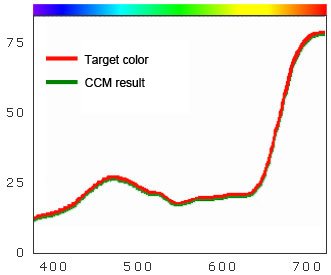
Fig. 20: Isomeric matching
| Light source D65 | Light source A | ||
|---|---|---|---|
| Light source D65 | CCM result | Target color | CCM result |
| L=50.73 | L=50.73 | L=50.79 | L=50.79 |
| a=4.01 | a=4.01 | a=3.51 | a=3.51 |
| b=-4.37 | b=-4.37 | b=-5.02 | b=-5.02 |
| ΔE=0.00 | ΔE=0.00 | ||
4-4-2. Metameric matching
A method for matching three stimulation values with the target color is available. CCM using this method is called metameric matching.
Matching a visual color with three stimulation values involves the risk that the color will not be matched under a different light source even though it is matched under the calculated light source(i.e., metamerism)However, this method has an advantage in that almost all colors can be produced using available coloring materials.
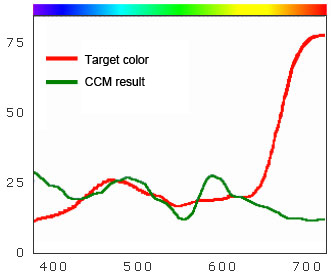
Fig. 21: Metameric matching
| Light source D65 | Light source A | ||
|---|---|---|---|
| Target color | CCM result | Target color | CCM result |
| L=50.73 | L=50.73 | L=50.79 | L=50.95 |
| a=4.01 | a=4.01 | a=3.51 | a=6.98 |
| b=-4.37 | b=-4.37 | b=-5.02 | b=-4.88 |
| ΔE=0.00 | ΔE=3.48 | ||
4-4-3. Metameric matching]
Isomeric matching and metameric matching are generally used as shown in Fig. 22. This flow is devised so as to obtain a better result by performing isomeric matching, wherever possible, to avoid the effect of metamerism and by carrying out metameric matching for the rest.
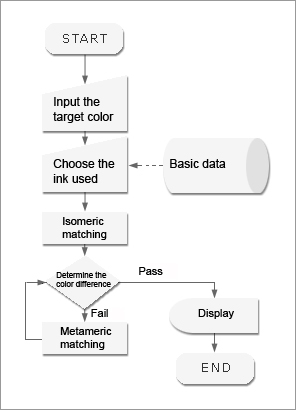
Fig. 22: General CCM flow
In addition to this basic matching, we conduct fuzzy matching and neuro-matching so that our design provides the best solution for minimizing possiblemetamerism problems.