Infrared measuring technologies
Noncontact / Non-destructive measurement of chemical liquid concentrations and film thickness.
The absorption characteristic of infrared rays enables every kind of measurement.
The infrared absorption moisture meter / thickness meter is non-contact, with high response speed and easy to operate. The construction of these devices are the same; the moisture meter measures the -OH group absorption, and the thickness meter measures the -CH group absorption which is inclusive in the organic resin.
Our liquid component analyzer reduces errors caused by overlaps by simultaneously using eight kinds of wavelengths of near-infrared rays. Adopting a dedicated optical system, it can measure changes in absorbance with 50 to 100 times higher accuracy than commercially available spectroscopes.
About concentration measurement using infrared rays
Functional films are required for different functions and characters based on different applications. Like optical films which are made from LCD and PDP, these kinds of display materials, should satisfy thickness and light requirements.
Therefore, many companies are developing only one plastic film with multiple functions. On the other hand, it goes without saying that some functions could not be satisfied by using single layer film until they are coated with functional resin and laminated with different functional films. In this kind of background, the film thickness meter is necessary for the production of functional film. The film thickness meter is not only good for keeping costs down and improving yield ratio, but also for playing an important role in improving the products original functions.
Besides our infrared absorption method, there are lots of methods to measure film thickness. For example, 1.radiation method (β-ray, γ-ray, χ-ray, fluorescent χ-ray); 2.light interference method; 3.laser method; 4.electrostatic capacity method; 5.microwave method; 6.contact method. No matter which methods you choose, there are merits and flaws based on the material of the test object, the layer configuration, the measuring range, the required precision, the installation surroundings, and the price. It will be more important to choose the measuring methods and the applicable laws which can satisfy the test object and the required precision.
■ Mechanism of infrared measurement system (scheme)
TipsAbout infrared rays
Tips1.
What are infrared rays?
Regarding the wavelength of light, the light spectrum perceptible to humans, which is the spectrum between the ultraviolet region (wavelength shorter than violet light) and the infrared region (wavelength longer than red light), is called the visible spectrum.The sub-region of the infrared region closest to the visible region is called the near-infrared region. In contrast, the sub-region most distant from the visible region is called the far-infrared region and the sub-region between the two is called the mid-infrared region. Light has energy according to its frequency (the inverse of wavelength). Fig. 1 shows the relationship between frequency (wavelength) and energy levels.
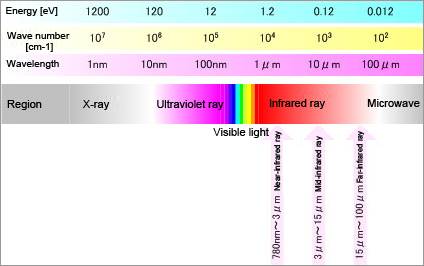
Fig. 1: Relationship between wavelength, frequency, and energy of light
Tips2.
Principle of near-infrared and mid-infrared spectroscopy
To see the principle of infrared spectroscopy, let’s first look at absorption in the most basic mid-infrared ray range.
When a certain substance is irradiated with mid-infrared rays, some of the rays are absorbed by the substance. The wavelength of the absorbed mid-infrared rays and the absorption level (absorbance or transmission) are determined by the substance. Therefore, when the absorption spectrum for mid-infrared rays is measured, the spectrum specific to the substance can be obtained.
When light with frequency ν is absorbed by molecules, the energy of the molecules increases by E = hν (h stands for Plank's constant). In the case of mid-infrared rays, the energy is just equivalent to the molecular vibration energy level. As shown in Fig. 2, this means that the molecules in the ground state of vibration absorb mid-infrared rays and then can make a transition to the first excitation state of vibration. However, if the substance is irradiated with light that fulfills E = hν, mid-infrared rays are not always absorbed. It should be noted that some transitions are permitted by the selection principle (permitted transitions) and others are not (forbidden transitions).
The first one is that only the transitions where vibrational quantum number (v) changes by +/-1 are permitted. These transitions correspond to the fundamental vibration tones. Vibrations of +/-2, +/-3, etc. equivalent to harmonic tones are called forbidden transitions, which are essentially not permitted.
The second one is that mid-infrared rays are absorbed only when the electrical dipole moment of the whole molecule changes due to certain molecular vibrations. The mid-infrared spectrum specific to the substance is determined by these two restrictions.
Now, let’s consider near-infrared spectroscopy.
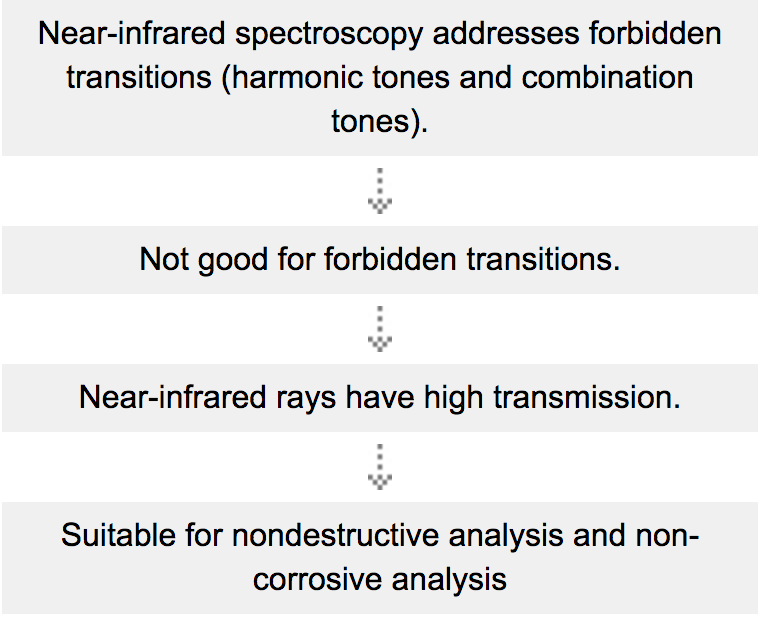
Near-infrared spectroscopy is considered to be spectroscopy based on harmonic tones and combination tones involved in forbidden transitions. Then, why are harmonic tones and combination tones, which are primarily forbidden, observed in a spectrum? The reason is that molecular vibrations are not completely harmonic vibrations (according to Hooke's law), but have anharmonicity. The event probability of harmonic tones and combination tones is low, though, and few near-infrared rays are absorbed compared to mid-infrared rays. Near-infrared spectroscopy is spectroscopy that addresses very faint bands. This characteristic, which seems to be a disadvantage, leads to a great advantage in near-infrared spectroscopy, as will be described later.
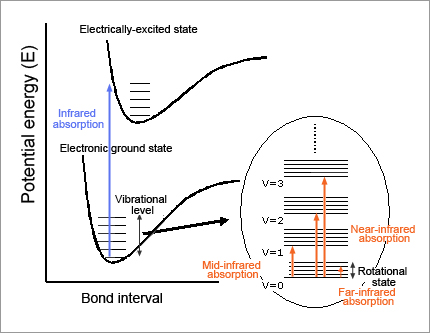
Fig. 2: Relationship between molecular energy level and absorption band
Tips3.
Features of near-infrared and mid-infrared spectroscopy
The common advantages of near-infrared spectroscopy and mid-infrared spectroscopy are listed below:
・Most unlikely to damage the sample because electromagnetic waves of low energy levels are used (this also means that humans are hardly affected)
・Applicable for variety of samples, such as solids, powders, fibers, pastes, liquids, solutions, and gases
・Applicable for diffuse reflection and photoacoustic spectroscopy (PAS) as well as absorption.
The greatest feature limited to mid-infrared spectroscopy is that the mid-infrared spectroscopic analysis is equivalent to functional group analysis.
Mid-infrared spectroscopy does not only identify the kinds of functional groups such as C=0 and C=N, but also gives information on the environment in which they are placed. This spectroscopy covers the region in which something like "fingerprints" of molecules are obtained. Mid-infrared spectroscopy has a much higher absorption characteristic than the near-infrared spectroscopy. It is, therefore, effective for the easy analysis of samples of very small amount (in the order of ng [nanogram: one billionth of 1 gram])or size (in the order of μm [micron: one thousandth of 1 mm]), for which near-infrared spectroscopy is comparatively inferior.
One of the features limited to near-infrared spectroscopy is that it addresses forbidden transitions.
Shown above is the relationship between the principle and features of near-infrared spectroscopy.
Therefore, near-infrared spectroscopy allows optical path length to be handled considerably freely (in the mid-infrared region, the optical path length must be made very short because the absorption level is generally high). So 10mm and 100mm cells can be used. In particular, the near-infrared region enables much more diverse kinds of solutions to be measured for studies and analyses of aqueous solutions than the mid-infrared region analysis. Other kinds of samples can be measured without changing their thickness and dimensions.
When the principle-based features of near-infrared spectroscopy and mid-infrared spectroscopy are compared to each other, their respective advantages and usages are clearly understandable.
The following sections 2 and 3 describe fluid component analyzers and film thickness meters, for which near-infrared spectroscopy and mid-infrared spectroscopy are often applied industrially.
TipsAbout liquid component analyzers
Tips1.
Measuring principle
Near-infrared rays refer to the wavelength band between 800 and 2500nm.
This region shows spectrums that accurately reflect molecular information, although it is complicated by high-order vibrations and combination vibrations that appear as various kinds of molecular vibrations. Those spectrums mainly consist of vibrational absorption of OH and CH groups.
Our liquid component analyzers utilize a near-infrared band of 800 to 1400nm because (a) the distance in which light passes through liquid is approximately 10mm at these wavelengths, making the analyzers easy to handle and (b) the spectrums most greatly and most diversely change in regard to concentration. (For the mid-infrared region, the cell length is in microns, making the analyzers difficult to handle.)
However, the use of the near-infrared region involves these disadvantages: (a) since high-order vibrations appear in molecular vibrations, the absorption band has large width and greatly overlaps with absorption bands and (b) since the characteristic absorption of mid-infrared rays shows a sharp spectral shape, even though it would be best to simply measure one wavelength related to a certain component and its neighborhood as a comparative wavelength, concentrations cannot be quantitatively determined only by such simple measurements of wavelengths because of great overlapping of the near-infrared band.
For these reasons, our liquid component analyzers use 8 wavelengths to measure components by multivariable analysis at multiple wavelengths. For this 8-wavelength spectroscopy, a band pass filter called an interference filter is used. The selection of wavelength is dependent on the measured sample system and the following criteria are used for comprehensive determination.
・Wavelength equivalent to the characteristic absorption of the functional group of the component being measured
・Wavelength at which spectrum variations due to the hydration phenomenon are large
・Wavelength combinations at which temperature variations and scattering variations can be canceled.
・Wavelength characteristics of the unit, such as sensor sensitivity and light source variations.
Prepare a calibration curve for the correlation between absorbance changes at each wavelength and concentration changes of the sample. Use this calibration curve to quantitatively determine the components of an unknown sample.
Tips2.
Detailed measuring principle
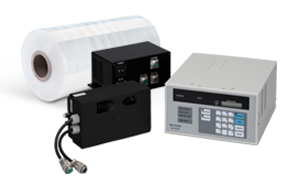
The light from the lamp passes through interference filters and is dispersed. A disc having 8 interference filters on it rotates at a speed of 15 revolutions per second.
The light that has passed the interference filters is condensed at the flow cell and then passes through the sample.
The light that has passed through the flow cell is condensed at the sensor.
The signals that have been converted into electric signals by the sensor are separated into signals at 8 wavelengths, which are then converted from analog to digital.
These signals are sent to a data processing unit by the microprocessor.
In the data processing unit, the following equation is used to obtain absorbances A1 through A8 at 8 wavelengths.
A (i) = -log (sample transmission intensity at wavelength i) / (blank transmission intensity at wavelength i)
According to the Lambert-Beer law,
A (i) = aibc
A (i) : absorbance at wavelength i
a (i) : absorbance index at wavelength i
b : cell length
c : sample concentration
Absorbance index ai is a specific value that is determined by the given substance. Since cell length b is constant, we can assume a constant value in k (i) = a (i) b.
Hence, the following equation is established showing that concentration and absorbance are related proportionally.
A (i) = k (i) c
For a substance consisting of 2 components. C1 and C2, the above equation is modified resulting in the equation below:
C1 = p11A1 + p12A2 + p13A3 + …… + p18A8
C2 = p21A1 + p22A2 + p23A3 + …… + p28A8
When these are processed using matrix representation, the following equation is established:
A P matrix corresponds to the coefficients for a calibration curve. Previously determine the p matrix by using a standard sample and then measure the absorbance of a sample with an unknown concentration. This allows you to obtain a calculated concentration. The actual quantitative algorithm is slightly different from the above method, but the basic data processing concept is the same.
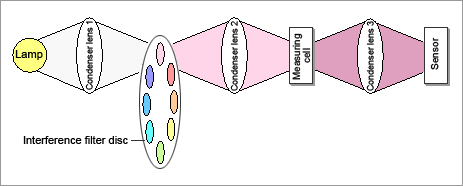
Fig. 3: Diagram of measuring principle
Tips3.
Application to inorganic electrolyte concentration measurement
Sodium hydroxide and hydrochloric acid are typical examples of inorganic electrolytes, and they do not have molecules. In their aqueous solutions, sodium ions (Na+), hydroxide ions (OH-), hydrogen ions (H+), and chlorine ions (Cl-) are present instead. For those aqueous solutions, therefore, there are no absorption spectrums originating from molecular vibrations in either the infrared region or the near-infrared region. For this reason, it was believed that their concentrations could not be measured using infrared absorption spectrums.
Ions in an aqueous solution are not simply suspended amidst water molecules, but form clusters by bonding with neighboring water molecules through hydration. For example, chlorine ions (Cl-) are charged with negative electricity, so hydrogen atoms of water molecules are coordinated with chlorine ions. The water molecules coordinated with ions have slightly different vibration patterns from those of free water molecules, changing the absorption spectrum for near-infrared rays. Detecting this slight change allows for finding the kind and concentration of dissolved ions. In the past, the spectral change was not used because (a) it was so slight that it was not considered to be information that could be effectively used and (b) the important fact that there is an original spectral change for each kind of ion had not yet be discovered.
For example, the acid concentrations in a mixture of phosphoric acid, sulfuric acid, and acetic acid, which are often used in the LCD manufacturing process, can be measured. This acid mixture is an inorganic electrolyte, which has no marked characteristic absorption in the near-infrared region. However, the spectral form for the water contained in the mixture changes slightly depending on the concentration of each acid. Our liquid component analyzer accurately detects this change, allowing you to measure the concentrations of inorganic electrolytic components by using the previously created calibration curve data.
Tips4.
Innovations for process measuremen
Highly accurate absorbance measurements; i.e., high-accuracy measurement of concentrations
In order to detect a very slight spectral change due to hydration bond, a dedicated bright optical system is used. As a result, our liquid component analyzers are capable of reading 50 to 100 times smaller changes in absorbance than commercially available spectroscopes for laboratory use, thereby achieving highly accurate measurements of concentrations.
Not affected by changes in sample temperature
Near-infrared spectrums have the disadvantage that they are affected by changes in sample temperature. Normally the sample temperature is kept constant. However, temperature control in units of 0.1 degree or smaller becomes necessary to measure very slight spectral changes. This is very difficult from the viewpoint of system technology and quite impractical because you have to wait a long time before a constant temperature is reached.
We consider temperature change as one element and reflect it in the calibration curve. It is possible, therefore, to practically measure the concentrations of components without having the measurements affected by changes in sample temperature.
Not affected by bubbles and fluctuations in the sample
To measure components in a process, extract a sample using a suction pump, send it to the cell in the spectroscope, and then transmit light through it. Normally, the sample liquid has concentration irregularities, bubbles, and fluctuations. In the past, in order to eliminate them, the liquid was passed through a defoaming device or the like so that it is homogenized before optical measurement. It was difficult, however, to obtain complete defoaming. In particular, highly viscous liquid was very difficult to defoam. The time required for defoaming markedly decreased of the time required to obtain measurements.
Our liquid component analyzers make 15 high-speed spectroscopic measurements per second. Therefore, data affected by bubbles or fluctuation in the cell can be clearly discriminated from among the other normal measurement data at intervals of 1 / 15 second. The abnormal data can be eliminated before the averaging procedure so that only the normal, stable data is used for the average procedure, achieving very stable measurements by eliminating the effects of bubbles, fluctuations, etc. beforehand.
TipsAbout infrared film thickness meters
Tips1.
What are infrared film thickness meters? Various kinds of film thickness meters. Superiority of the infrared film thickness meters
What are infrared film thickness meters?
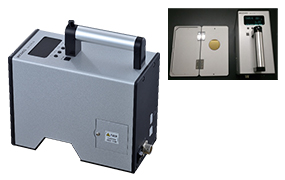
Infrared absorption-type moisture meters and film thickness meters carry out contact-free measurement at high response speed and are relatively easy to handle. So they are widely used as online measuring instruments on manufacturing sites. These products, to which the principle for infrared spectroscopes was applied for online use, were primarily developed to measure moisture.
Moisture meters are used to measure moisture percentage in powder in the chemical, ceramic, and food industries and pulp during production. Film thickness meters are used to measure the thickness of plastic film and coating quantities of various kinds of coating materials in the convertech industry. Both of them are accepted as indispensable measuring instruments on all such production sites.
These two kinds of measuring instruments have exactly the same configuration. Moisture meters use the OH group absorption band in water, while film thickness meters use the CH group absorption band in organic resin.
Various types of film thickness meters
In addition to infrared meters, various others types of film thickness meters and thickness meters have been put on the market using various measuring methods.
Those types include:
the radiation type (using beta rays, gamma rays, X-rays, fluorescent X-rays, etc.);
the optical interferotype;
the laser type;
the capacitance type; and
the capacitance type; and
the contact type.
Some film thickness meters using the same infrared rays employ all-wavelength spectrums as described here rather than wavelengths that are previously fixed (interference filter type). Recently, the photothermal measurement type has come to market, which puts off infrared rays and analyzes film thickness based on the phase difference of the thermal waves reflected from the object being measured.
Ideal film thickness meters have sensitivity only toward the object being measured. All of the above measuring methods have both advantages and disadvantages in relation to the material and layer configuration of the object being measured, the measurable range, the required accuracy, the installation environment, the price, etc. In this respect, it is most important to choose the most suitable film thickness meter for the object being measured and the intended measurement purpose.
This section describes mainly the principle of the interference filter-type infrared film thickness meter, which is the most common and has a proven record, and examples of its usages.
Superiority of infrared film thickness meters
The main features of the infrared film thickness meter in comparison with those of the other types of film thickness meters are listed below:
Makes contact-free measurements at high response speed and enables continuous measurements; minimal affect on the object being measured.
Requires no regulatory safety controls, unlike radiation-type thickness meters, and is easy to handle.
Unlikely to be affected by the vibration, surface conditions, color, turbidity, etc. of the object being measured.
Applicable to a broader range of objects that can be measured, a variety of materials and a wider measurable range of film thickness by combining the most suitable wavelengths.
Tips2.
Measuring principle of infrared film thickness meters
In the region where the wavelengths of infrared rays range from 2 to 20μm, characteristic absorption specific to the substance being measured occurs. This was described in "1-2. Principle of near-infrared and mid-infrared spectroscopy." This characteristic absorption occurs intrinsically and independently from the chemical bonding power between molecular atoms and from the mass of each atom. As an example, Fig. 4 shows infrared absorption spectrums for water (H20) and polyethylene (-CH2-CH2-)n. You can see that the -OH group is absorbed at 1.9 and 2.9μm for water and the -CH group at 2.3 and 3.4μm for polyethylene.
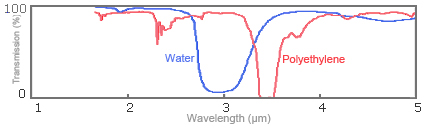
Fig. 4: Spectrums for infrared absorption of water and polyethylene
In order to show how any difference in film thickness appears in a spectrum, Fig. 5 shows infrared absorption spectrums for water film of different thicknesses.
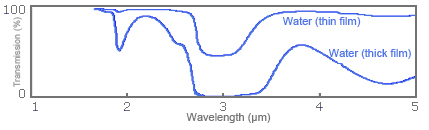
Fig. 5: Spectrums for infrared absorption of water film of different thicknesses
Thus, differences between the substances of materials cause various absorptions to occur in the infrared region. If the most suitable wavelength band is chosen and its absorptions can be measured, it is theoretically possible to measure samples ranging from a very thin coat of 0.1μm to a thick coat of several mm. It is easily understandable that in the convertech industry, where only the film thickness of the object under measurement is to be measured, the infrared-type meter, which allows for choosing the most suitable wavelength band, offers more benefits than the other types of film thickness meters using different measuring principles.
To practically apply the infrared type as a film thickness meter, register the relationship between the calibration curves (i.e., absorbance and film thickness) beforehand, and then convert the absorbance measured by the actual film meter into thickness values with the calibration curves and display them in real time.
In order to minimize the effects of external factors that are not directly related to changes in film thickness, such as variations of the light source for the sensor, contamination on the optical system, and the colors and turbidity of the object being measured, we have employed the three-wavelength method, which uses a comparative wavelength for both ends (low-frequency and high-frequency) at the characteristic absorption wavelength in addition to that wavelength itself.
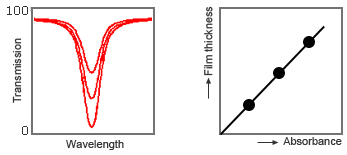
Fig. 6: Relationship between film thickness and absorbance (calibration curve)
Tips3.
Main uses and features
Measuring thickness of monolayer film
Measuring thickness of transparent and semi-transparent film such as PE, PP, PVC, PS, PET, and PI
Measuring thickness of multilayer film
Measuring thickness of each layer of multilayer film
Total thickness of multilayer film
Measurement of the thickness of coating films on film and metal
Measurement of the thickness of coating films applied to a film and coating films on a metal such as polyimide on copper foil
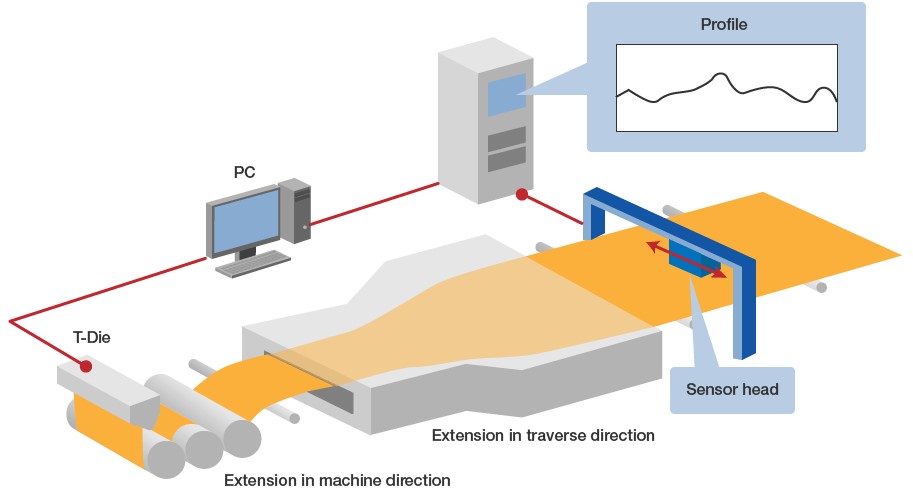
Fig. 7 shows an example of installation at a film manufacturer, in which the thickness of biaxial stretched film is measured.
Fig. 7: Isomeric matching
Tips4.
Wider range of applications
For the infrared film thickness meter, you need to choose a model, an interference filter, a detector, and other parts in accordance with the object being measured. For this purpose, you must have a good bit of knowledge and experience. The above choices make it possible to measure objects that could not be measured.
The performance of components for the infrared film thickness meter has been improved and new products have been released. These components are expected to further evolve along with the technological innovation of microprocessors. In addition to organic film, it has recently become possible to measure inorganic oxides such as phosphoric acid, silicon (SiO2), and alumina (Al203), and coatings on metal and vapor-deposited film, depending on the combination of substances.
In the future, as a result of improved cooperation and information exchange with our customers, we will be able to further improve the performance and functionality of our products and offer new models suitable for our customers’ purposes. This will lead to a further expansion in the products we can offer for use in a variety of fields.
By closely cooperating and exchanging information with users, KURABO will further improve the performance and functions of these systems and provide wider usage in each field by supplying new systems that meet the users’ respective purposes.